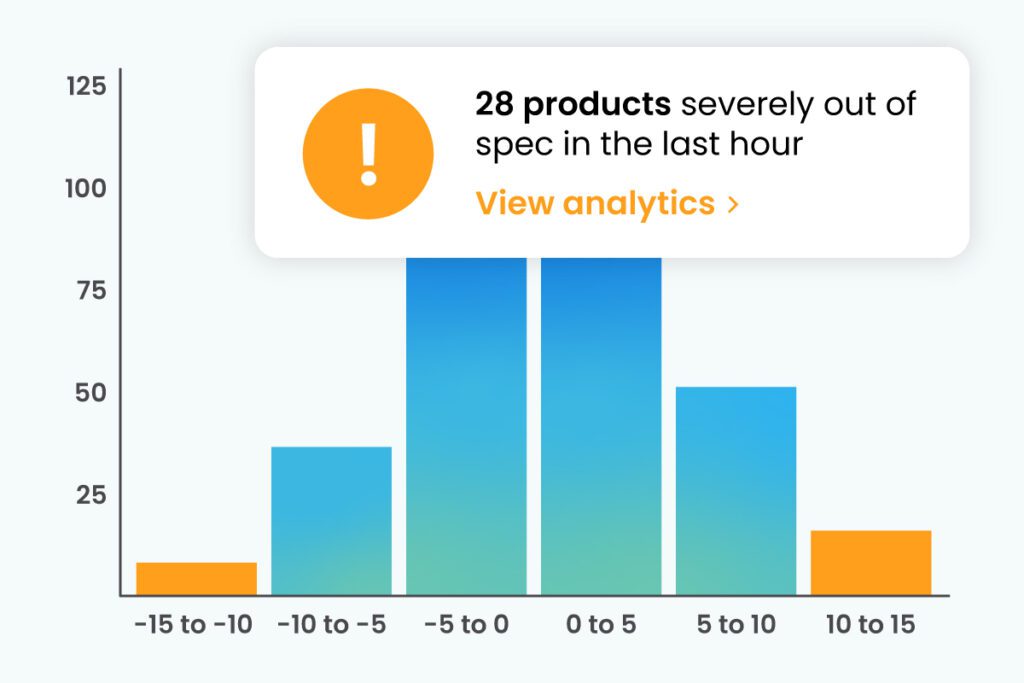
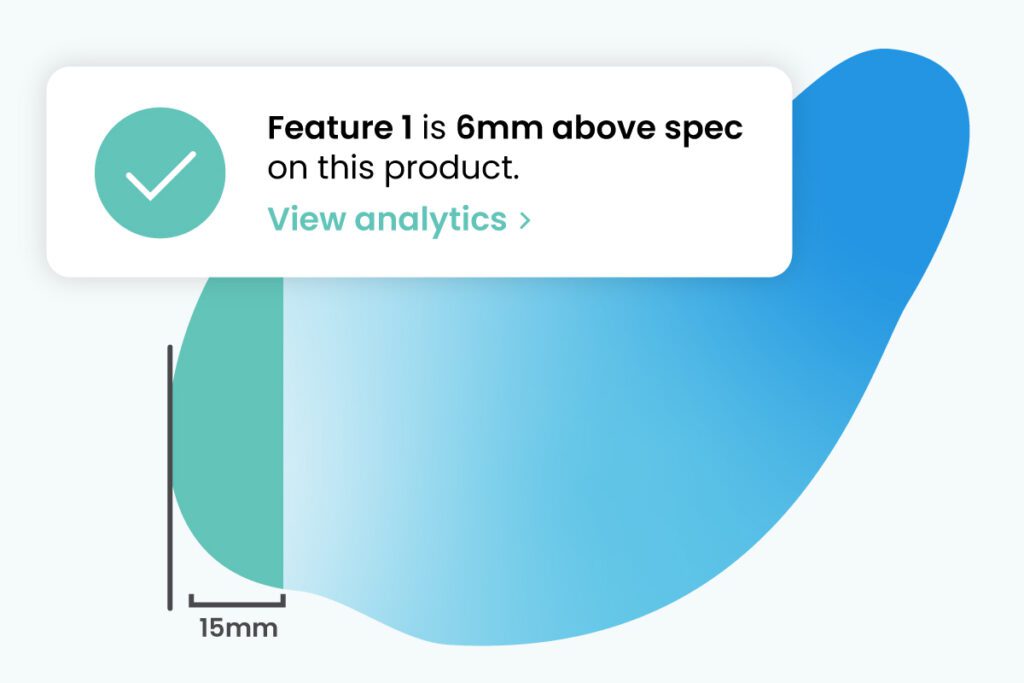
Understand food performance by measuring the most important features, unlocking yield and QA analysis, KPI reporting, and benchmarking of site operations.
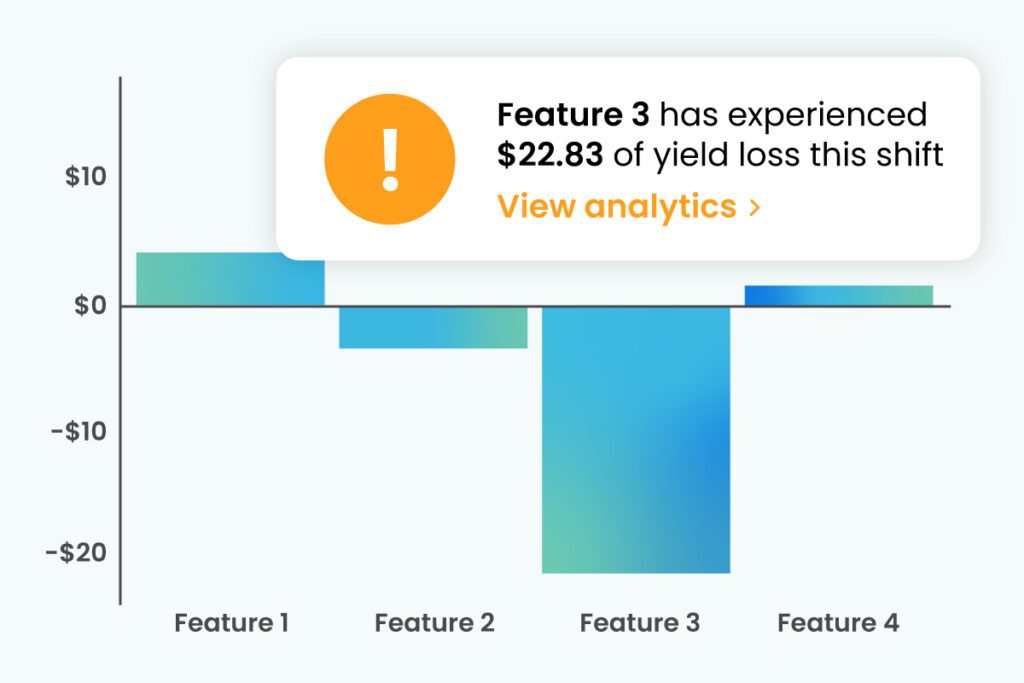
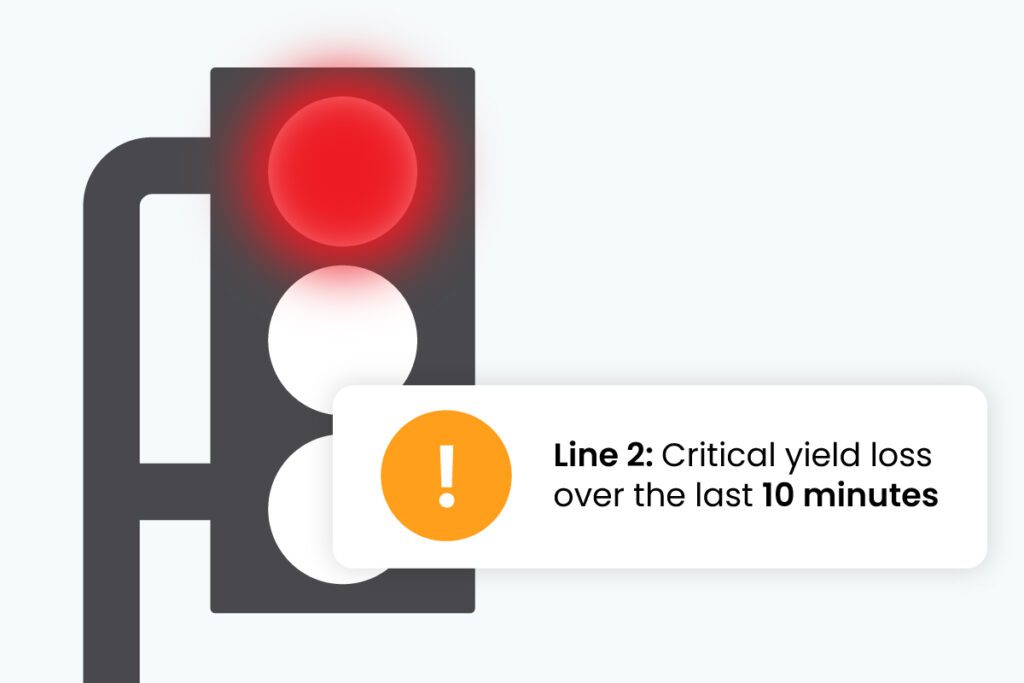
Identify gain and loss trends with product and financial reports.
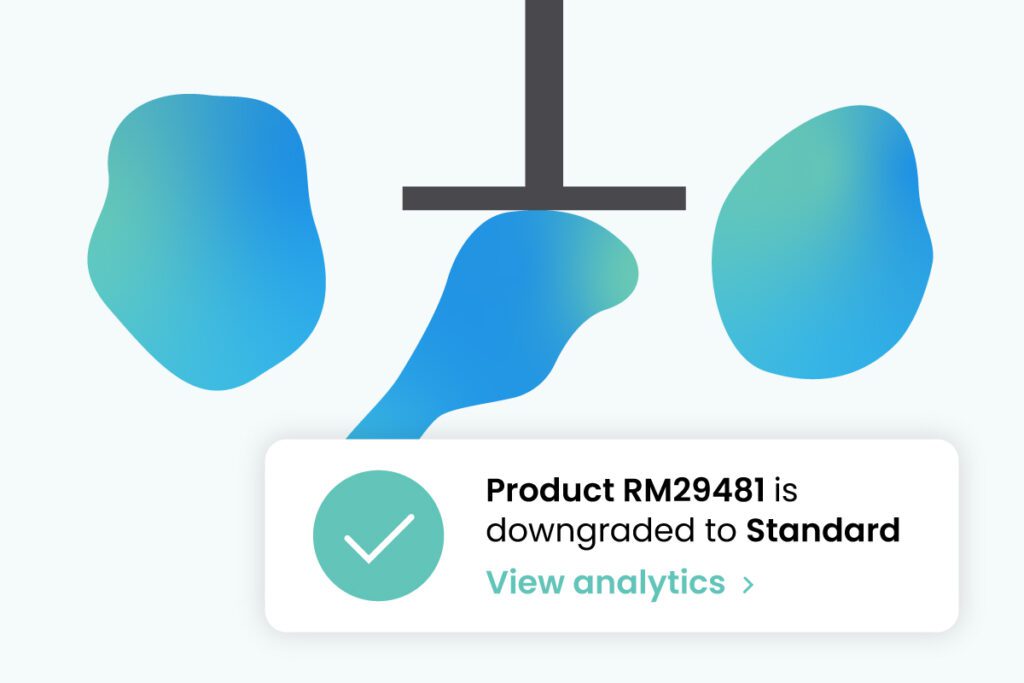
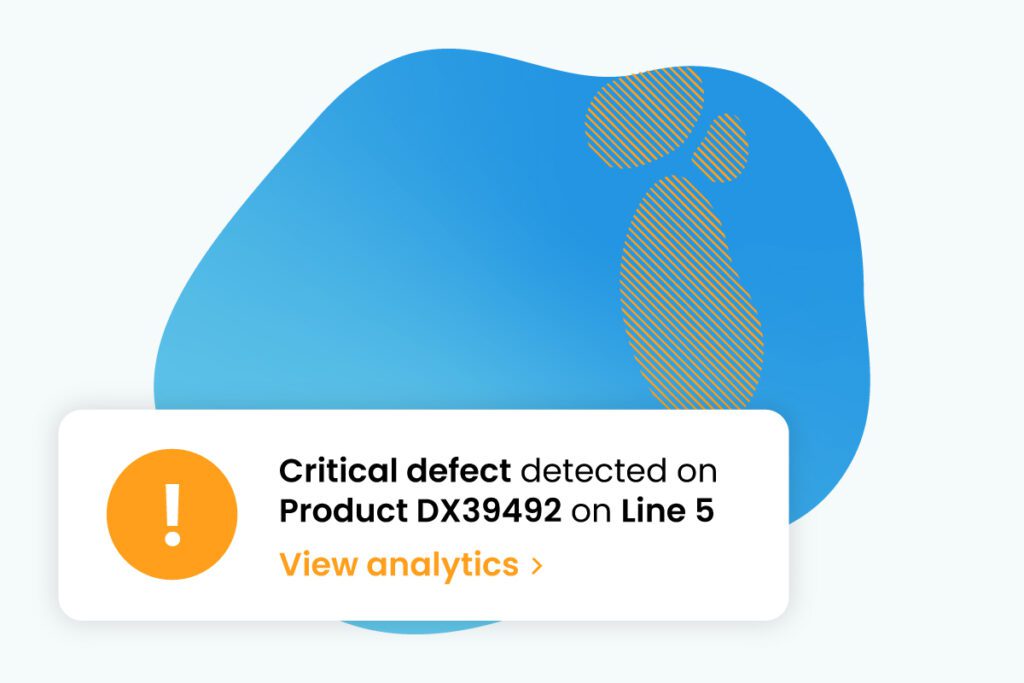
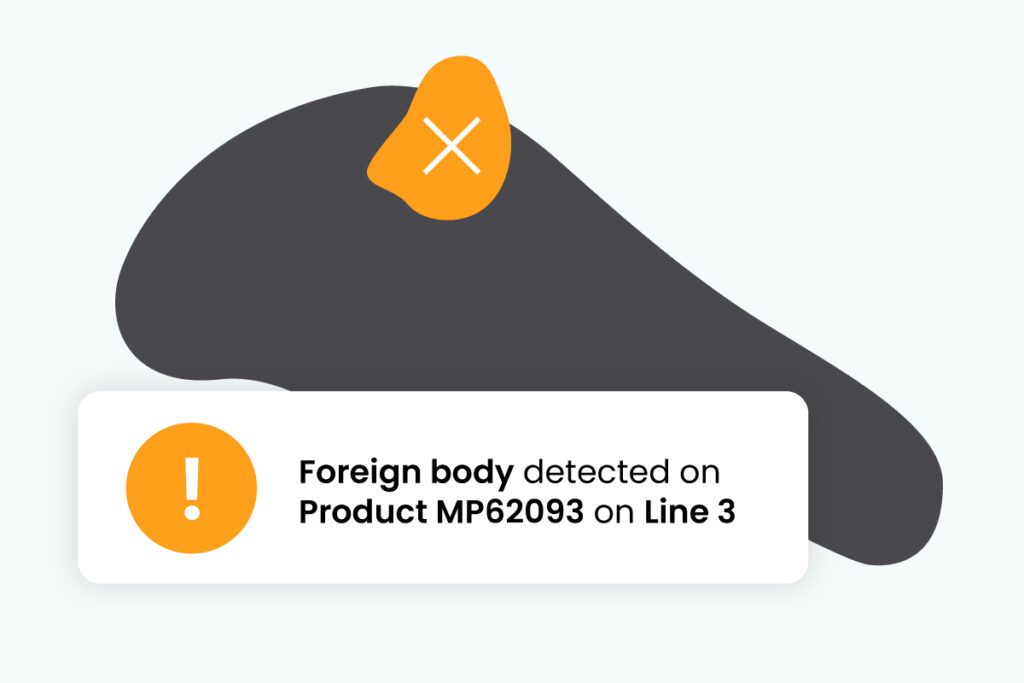
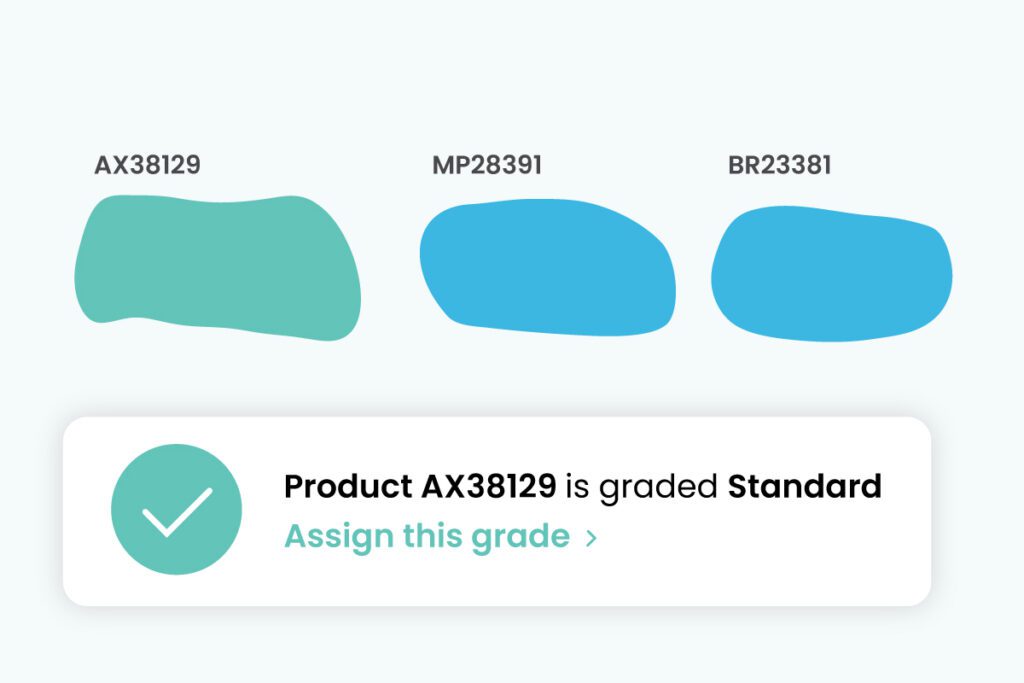
Grade and classify food products, identify defects and errors, and automatically sort, regrade, or reject products in real-time.
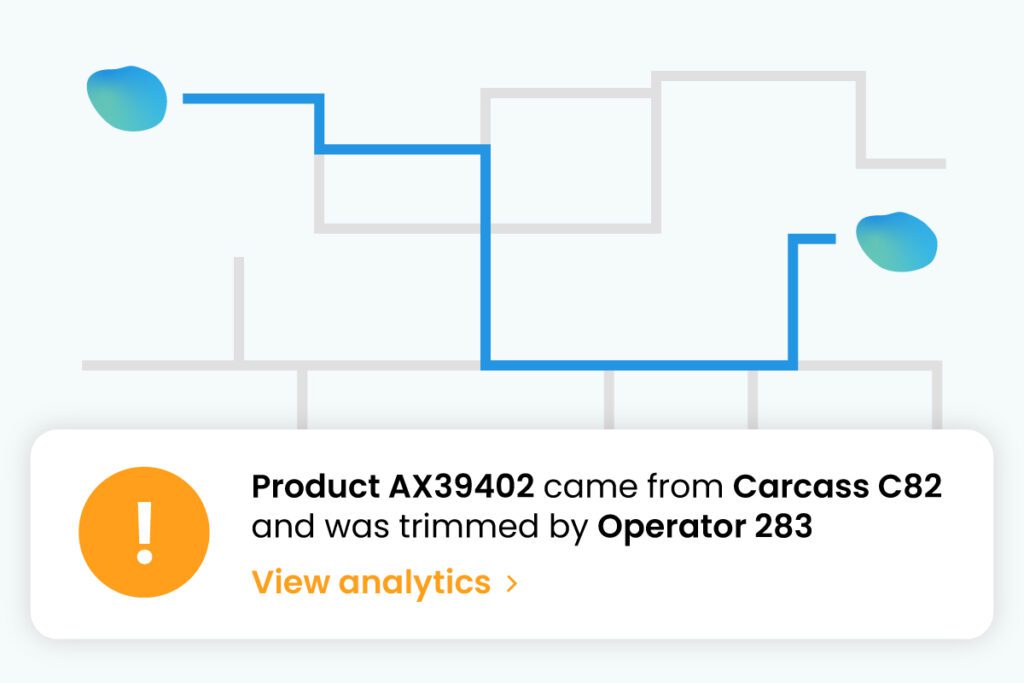
Analyze your process by piece, instead of by batch, without intrusive sensors or paper labels.
With a near-zero footprint, FloVision Nano can mount to existing hardware in any area of your facility and be installed with no production downtime.
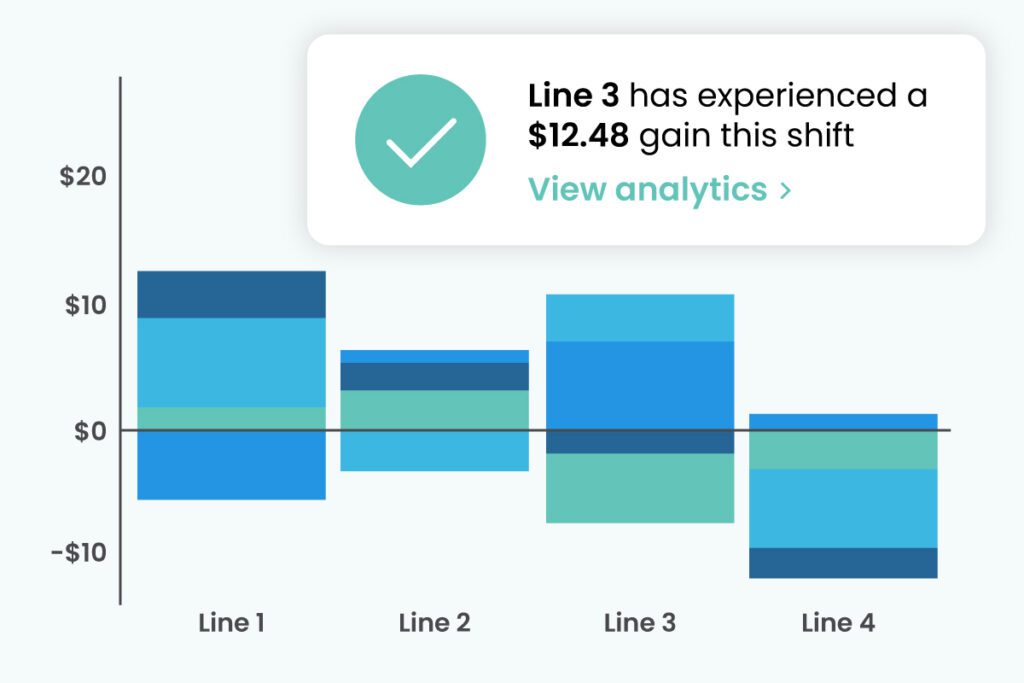
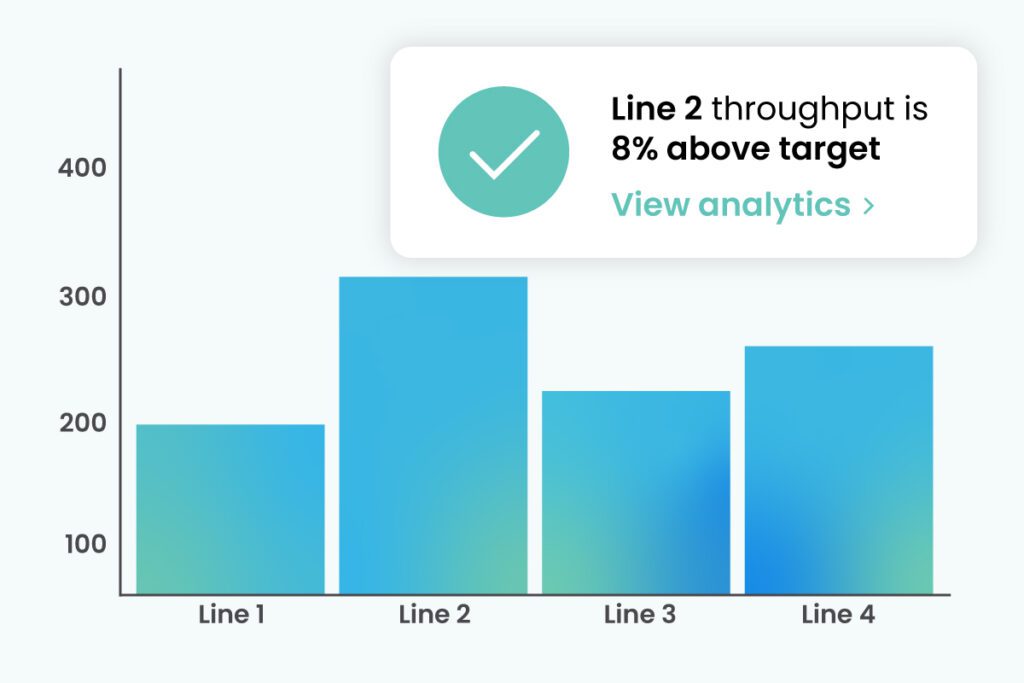
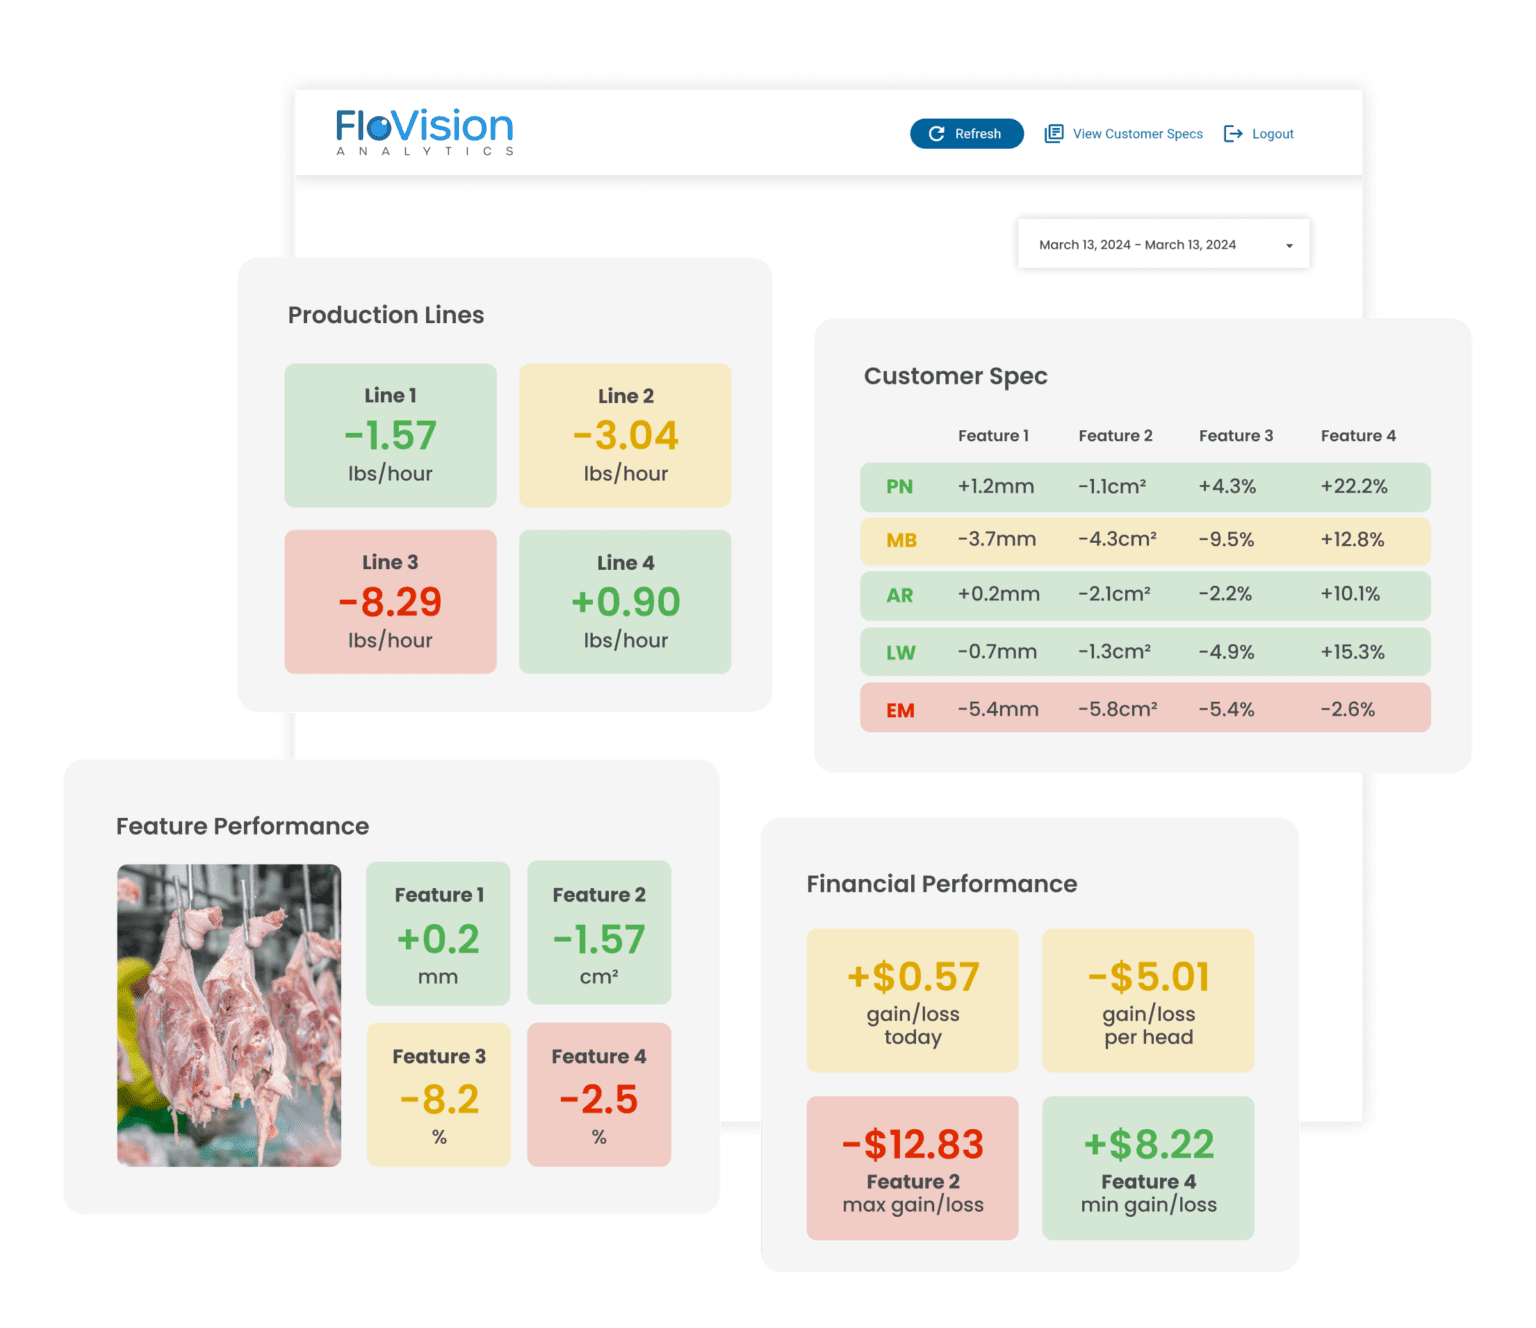
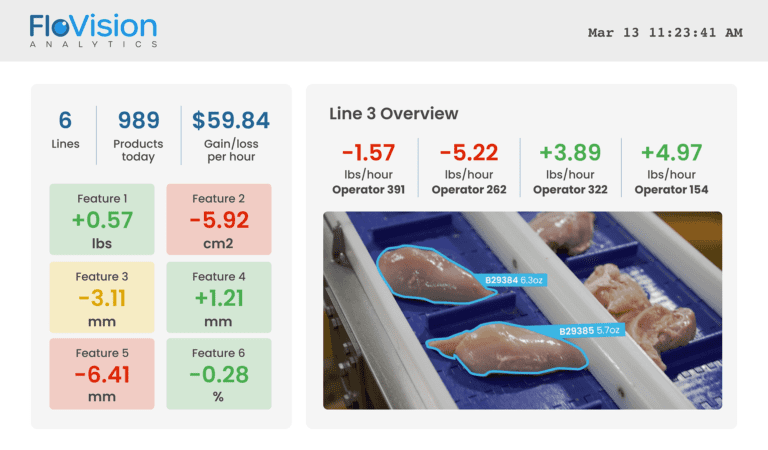
Yield, quality, financial, and staff performance data is organized into clear visualizations in the FloVision Analytics dashboard. Supervisors and managers can quickly review reports and trends for staff, customers, production lines and facilities, automatically receive updates via email, and integrate data seamlessly with APIs.
